How to climb the Data Quality Pyramid
Whether it’s fighting climate change or finding the nearest bus stop, creating insight requires data. The higher the quality of that data, the greater and more reliable the insight. What does good data look like, and how do we ascertain its quality level? In this article, we define the varying degrees of data quality, concentrating on three crucial assessment criteria: tidiness, syntax and semantics.

#Introduction
Data users mostly rely on a combination of human and computer to build reports, graphs, charts and maps. At Datopian, we think that the computer should be taking on more of the heavy lifting. And if computers are to start automating many of these processes, they are going to need good data.
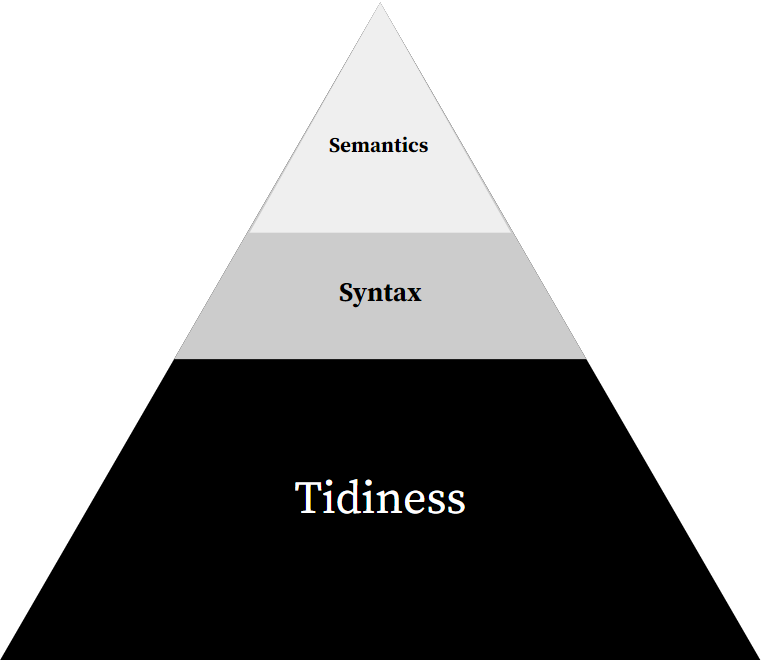
So, what is good data, and how do we define the different levels of data quality? Datopian submits that data quality can be broken down into three levels: tidiness, syntax and semantics. Together, these form the Data Quality Pyramid, which we discuss in the next section.
N.b. When discussing data quality within the context of this article, we are going to assume that a basic level of quality is already in place. We shall assume that the data:
- exists and is available
- is in digital form (so not on paper)
- is machine readable (so not a PDF of a scan)
Keep a look out for a follow-up article breaking down the different levels of data access and basic quality.
#The Data Quality Pyramid
To move up the Data Quality Pyramid, you have to start at the bottom and work your way up. Just as with a physical pyramid, the foundation needs to be in place before you can start building upwards. While the foundation layer may take the longest to lay, it is achieving the top part that is the most complex. The three levels of data quality can be distinguished as follows:
- Level 1: Tidiness (essential and foundational)
- Level 2: Syntax (easy to add and allows for automation)
- Level 3: Semantics (most complex)
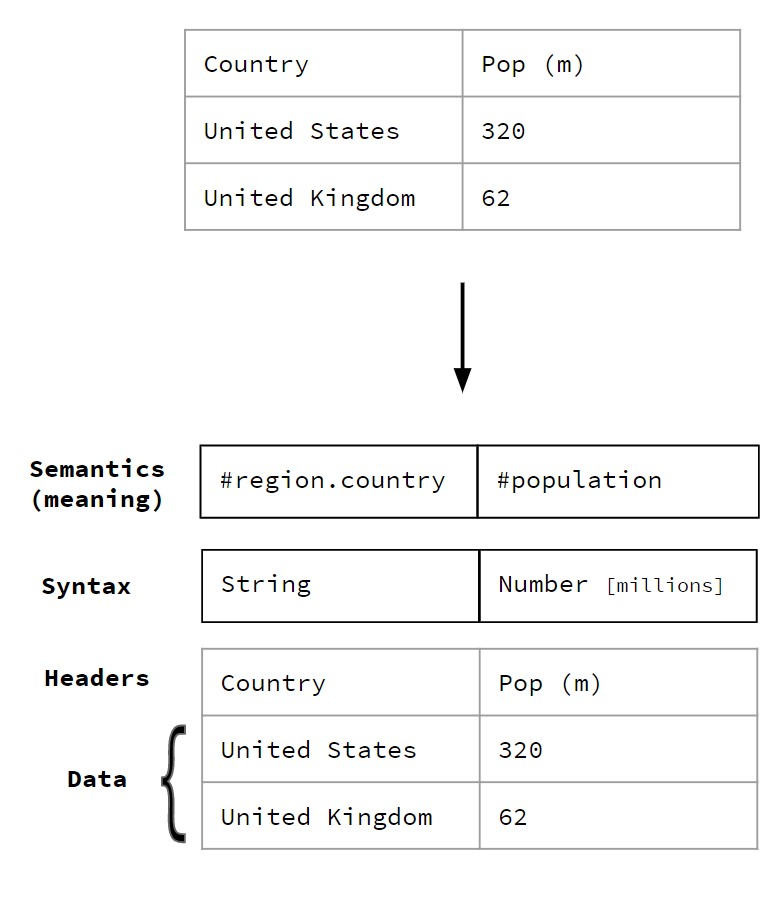
Here’s an example of how this breakdown looks when applied to data:

Let’s look at each level in more detail.
#Level 1: Tidiness
This is the most valuable characteristic to invest time in. It is also the most costly due to the effort needed to clean up the data. It is the factor that allows for machine reading and is the foundation for syntax and semantics.
#Level 2: Syntax
This factor brings additional value and is cheap to implement. When we talk about syntax in the context of data, we are referring to basic data types such as number, date, string etc. Adding syntax allows machines to better understand your data by giving it basic structure. As syntax is often very general and basic, agreeing a common standard for syntax does not often lead to dispute and, as such, is fairly cheap.
#Level 3: Semantics
Like tidiness, semantics is valuable but costly. It allows for machine processing such as automated data joining. The extent to which semantics is valuable depends on how many other people adopt the same semantics. However, coming to an agreement on common semantics is a social process that can be difficult and slow. Semantics are also more complex to use and apply.
#Appendix
We can’t end a discussion on data quality without mentioning data standards and joining data. Here’s a short explanation of their role in supporting data quality.
#Data standards
Standards apply at each quality level and are especially relevant for syntax and semantics, in the sense that they define the syntax and semantics to use. There are many different standards that come into play at each level. These are:
- Level 1: CSV
- Level 2: GeoJSON, Table Schema
- Level 3: Schema.org
#Joining data
In order to join different sets of data together, they must have a common identifier.
Here is an example in which the common identifier is the state:

The major problem in joining different data sets is that data quality is often poor, meaning it is untidy and lacks syntax and semantics.
#Here’s a slideshow version of this article:
Want to work with Datopian? We are data management experts providing open-source tooling and related services to organisations worldwide. Check our website for more information or contact us.
© Datopian (CC Attribution-Sharealike (by-sa))